How to choose the right summary measures
1 Which descriptive statistics to use?
- The choice of descriptive statistics depends on the type of data and the distribution of the data.
1.1 Categorical data
- Categorical data is summarized using frequencies and percentages.
1.2 Continuous data
- Continuous data is summarized using measures of central tendency and measures of dispersion.
1.2.1 Symmetric or roughly symmetric distributions
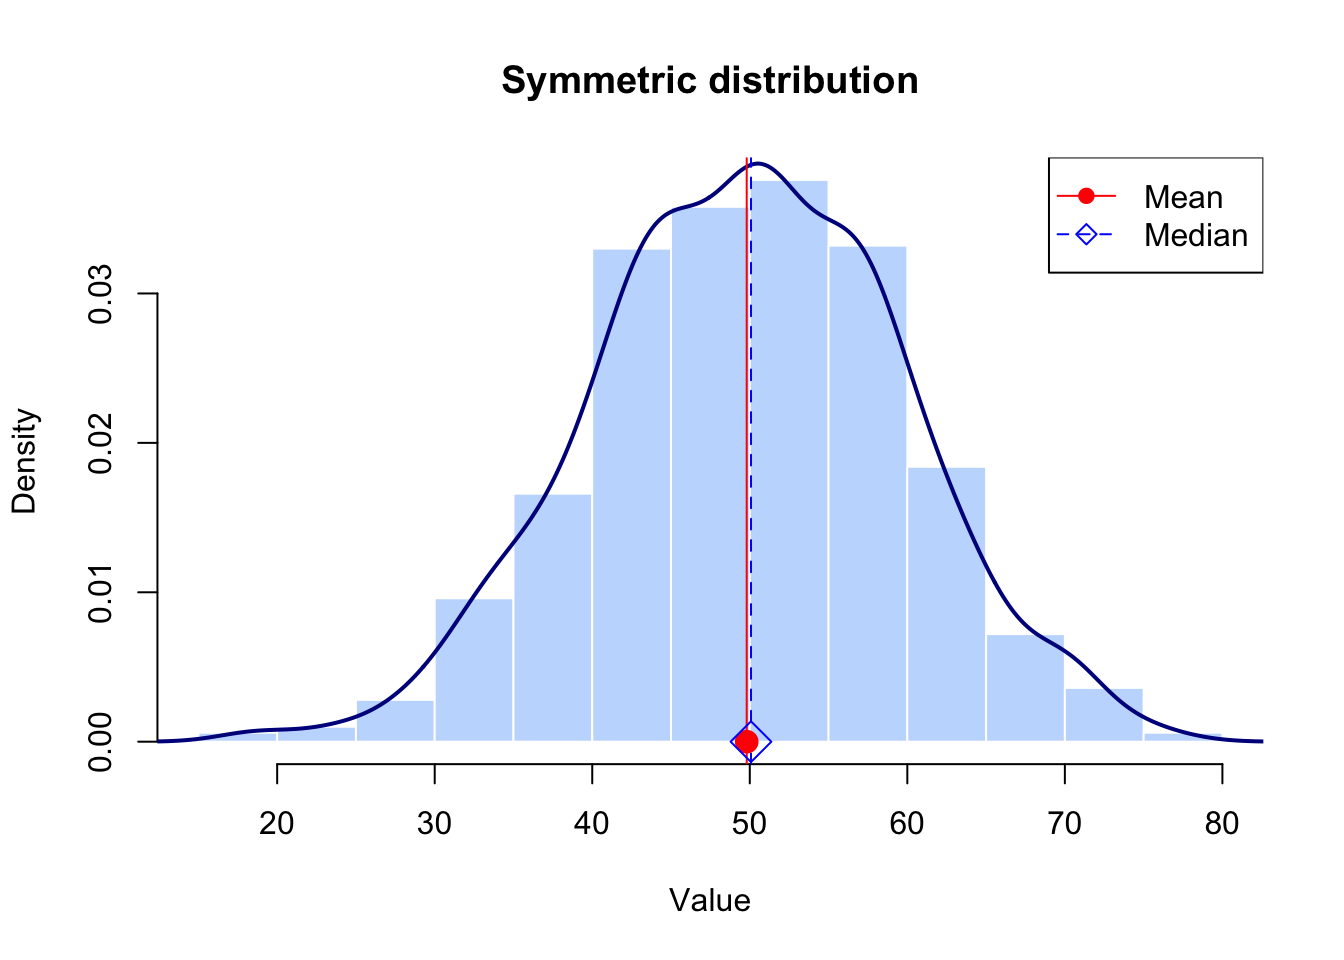
The mean and median are equal or approximately equal.
The mean and standard deviation are commonly used to summarize such data because they also help estimate the population parameters.
For example, the following figure shows a symmetric distribution with almost equal mean \((49.80)\) and median \((50.08)\) values.
For symmetric or nearly symmetric data, the mean and standard deviation are appropriate measures to summarize this data.
It is a common practice to report the mean and standard deviation as \(\bar{x} \pm s\), however, it is preferred to report them as \(\bar{x}\ (s)\) because the standard deviation cannot have a negative value.
1.2.2 Skewed distributions
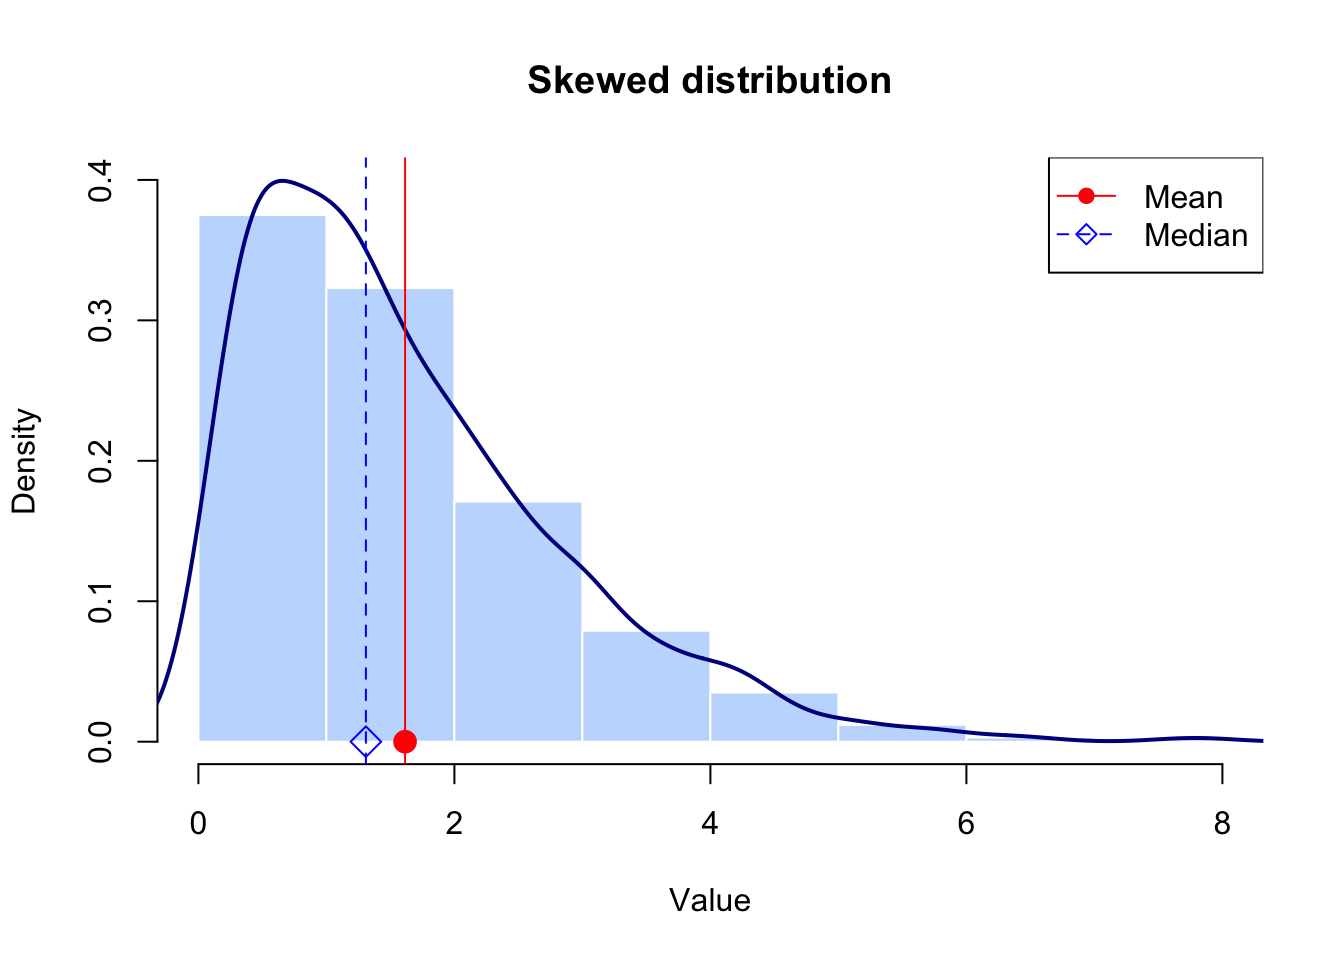
The mean and standard deviation are inappropriate because they are affected by extreme values and become misleading.
For example, the following figure shows a skewed distribution with different mean \((1.61)\) and median \((1.31)\) values. When the distribution is right skewed, the mean is greater than the median due to the effect of the extreme values on the mean.
For skewed distribution, the median and interquartile range are generally more appropriate measures because they are less affected by extreme values.
Note
Reporting the median for skewed data might not fully describe the data because there are extreme values and the median is based on a single value.
Some authors suggest reporting different measures such as the mean and median with either the trimean or trimmed mean. It is also prudent to report the range along with the interquartile range to provide a better understanding of the data.
1.2.3 Other special cases
1.2.3.1 Bimodal distributions
Such distributions have two distinct centers (i.e, peaks or modes).
This type of data comprises two distinct groups that may be analyzed separately if appropriate.
The presence of two groups might be attributed to different factors, such as gender, age, or treatment differences.
Both the mean and median become less informative in this case because both measures describe the location at the gap between the two groups (i.e., where there are relatively few observations). On the other hand, they do not describe the two centers (peaks) where most values fall.
For example, consider the following bimodal distribution:
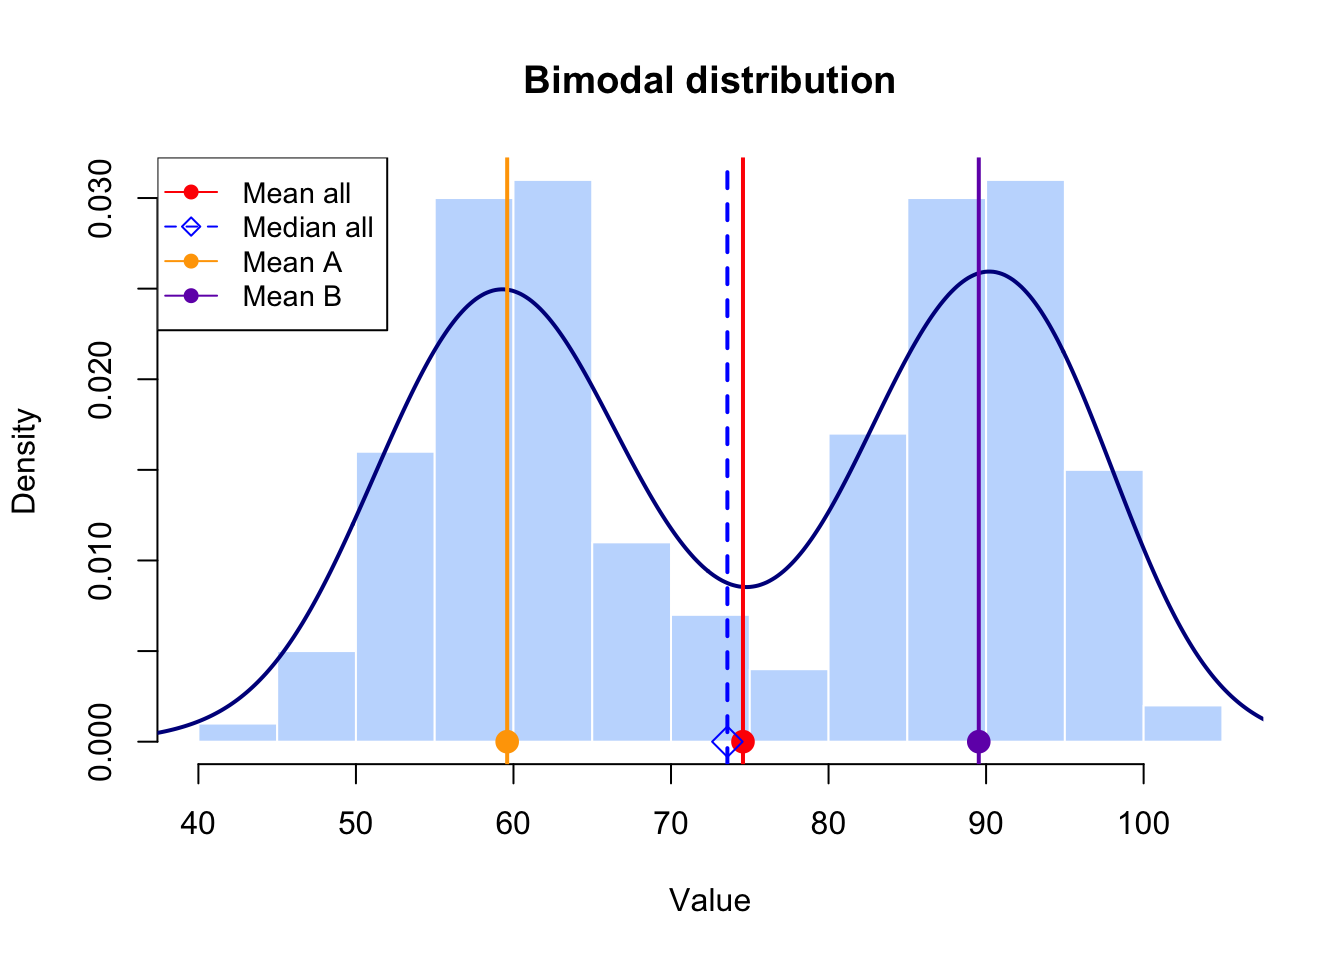
As depicted in the above histogram and density plot, there are two distinct peaks that might represent two different groups.
The mean \((74.57)\) () and median \((73.58)\) () values are not representative of any of the two groups.
Therefore, it is more informative to report the mean \((59.60)\) () and standard deviation \((5.68)\) for Group \(A\) and the mean \((89.54)\) () and standard deviation \((5.68)\) for Group B separately, given the distribution within each group is approximately symmetric.
2 References
Daniel, W. W. and Cross, C. L. (2013). Biostatistics: A Foundation for Analysis in the Health Sciences, Tenth edition. Wiley
Heumann, C., Schomaker, M., and Shalabh (2022). Introduction to Statistics and Data Analysis: With Exercises, Solutions and Applications in R. Springer
Hoffman, J. (2019). Basic Biostatistics for Medical and Biomedical Practitioners, Second Edition. Academic Press
Lane, D. M. et al., (2019). Introduction to Statistics. Online Edition. Retrieved September 14, 2024, from https://openstax.org/details/introduction-statistics